FloodGuard is the flood forecasting and early-warning platform of Via-Su, a sister company of Universal Software. Its AI side forecasts hourly river discharge and evaluates models specifically on the rare high-flow events that average scores hide. The AI forecasts run in three warning systems:
- TATUS, the flood forecasting and early-warning system of Türkiye’s Ministry of Agriculture and Forestry
- İTEUS, İSKİ’s Istanbul flood early-warning system
- Kocaeli İSU, Kocaeli’s water and sewerage administration
The R&D is TÜBİTAK 1832 project 3248302 (Green Transformation in Industry, 2024-2 call) and started in mid-2025. The code began as Teus, which is still the repository’s name.
I lead the AI side end to end: the forecasting design, data, models, evaluation, and serving. I lead five people: one ML engineer, two software engineers and two Via-Su hydrology engineers.
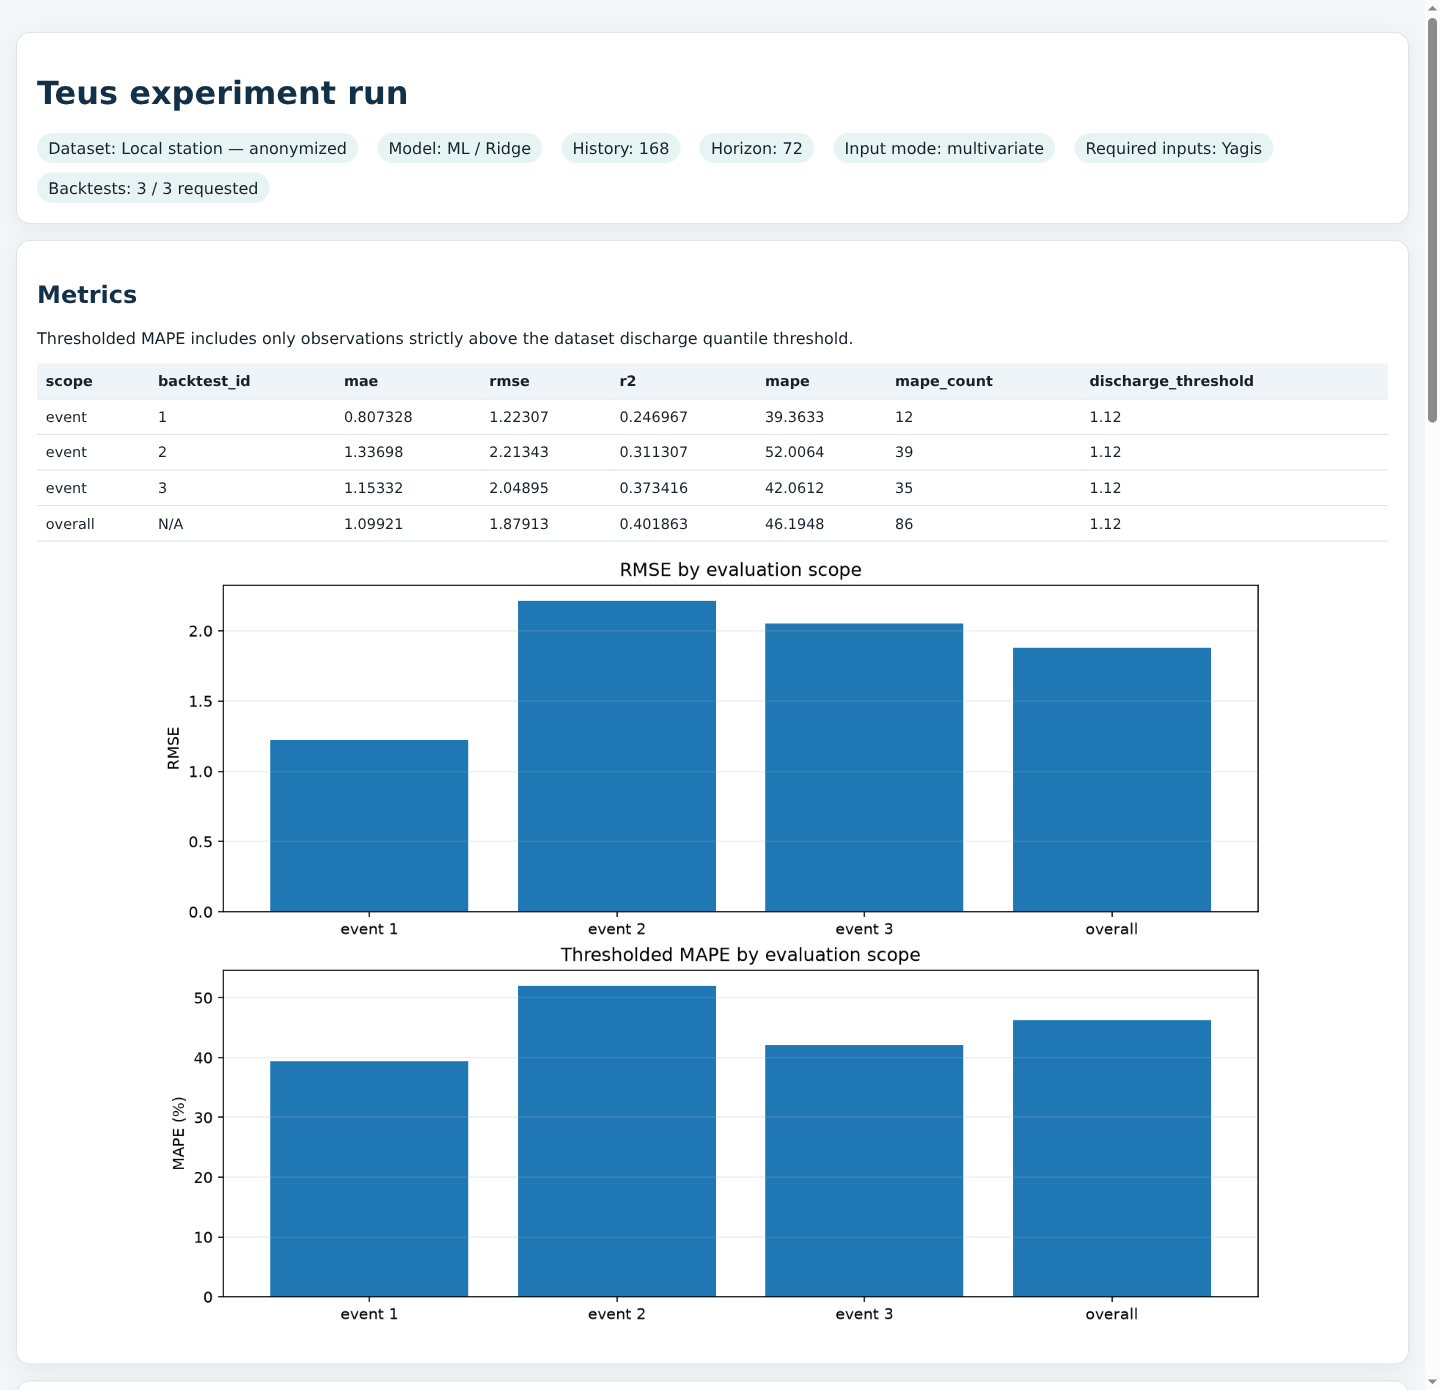
The attention seq2seq models in production were tested on selected flood events at five stations with observed rainfall, scoring 8% to 87% thresholded MAPE (below). A newer campaign scores every top-1% high-flow hour against persistence: the station-selected GRU beats it at three of the four GRU stations with high-flow test hours (27.6% vs 44.3% high-flow MAPE at D13A074), but no station meets the campaign’s accuracy gate yet.
The interactive FloodGuard walkthrough needs JavaScript.
The problem
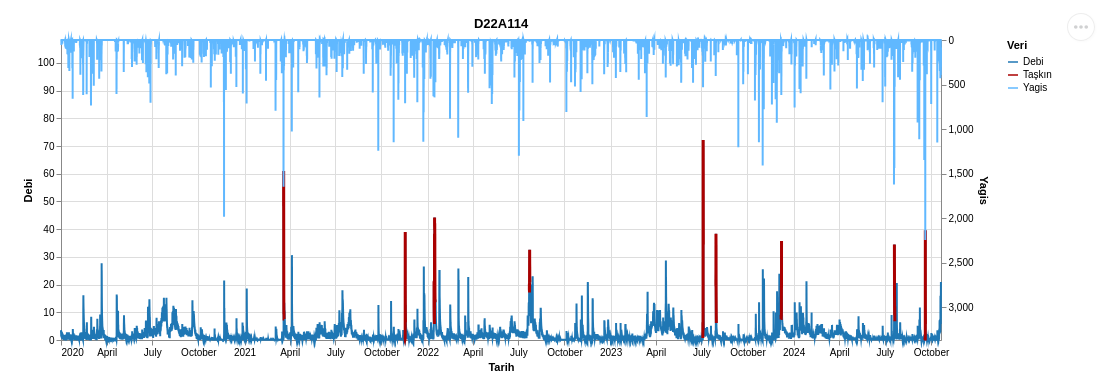
Floods are rare and fast, which creates three traps:
- A model that repeats normal conditions scores well on the full series and still misses every flood.
- Flashy basins go from baseflow to peak within hours, so discharge history alone gives little warning; rainfall has to be an input.
- Ordinary MAPE explodes near zero flow. FloodGuard reports thresholded MAPE, scored only on hours above a station’s 99th-percentile (P99) discharge.
What it does
- Compares classical and neural models, from Ridge, MLP and LSTM baselines to a seq2seq LSTM with attention and GRUs, on discharge and basin-weighted rainfall.
- Scores peak-event windows with expanding-window backtests, separately from ordinary flow.
- Writes every completed, persisted run’s predictions, metrics, plots, fitted model, and manifest to an inspectable report.
- Serves checkpoints that pass loading and input-contract checks through a FastAPI forecast service.
Older event runs issued 24- and 72-hour forecasts with the attention seq2seq model: at origin t the model reads the previous 168 hours and predicts every hour from t + 1 to t + 24, or to t + 72. Rainfall over the forecast window was the observed record from meteorological stations, not a weather forecast.
The newer campaign scores 1–12-hour leads at eight stations against persistence and seasonal-naive baselines on top-1% discharge hours. They are separate experiments, not one benchmark matrix.
Results and limits
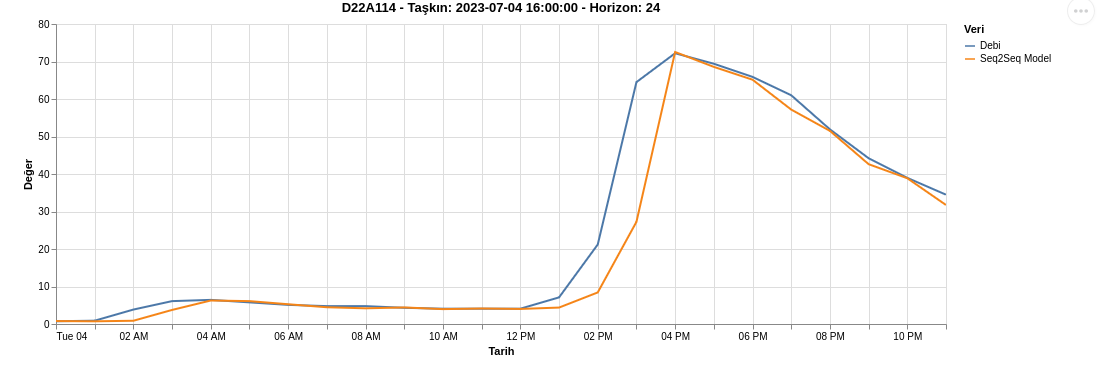
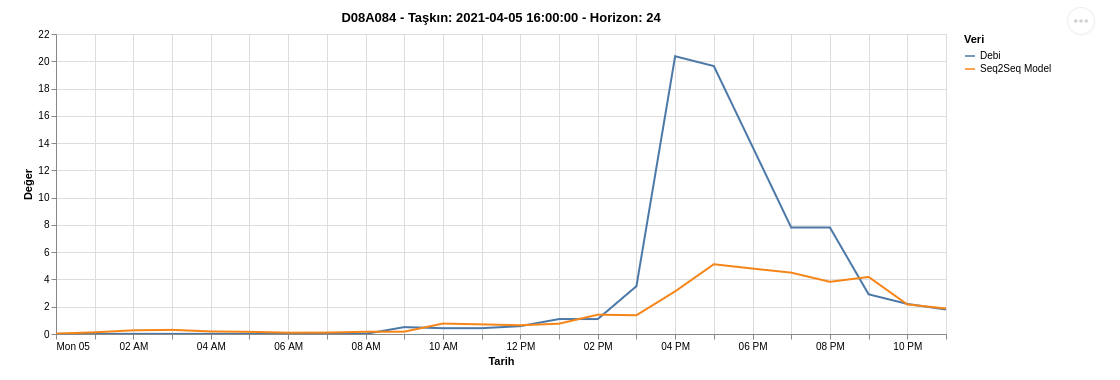
Selected events show both sides of the model. At D22A114 it matched the size and hour of a sharp peak. At D08A084, a small and flashy basin, it rose and peaked about an hour late and underestimated the peak fourfold:
Before the newer campaign, the attention seq2seq models were tested on flood events at five stations, at 24- and 72-hour horizons. Thresholded MAPE over each event window ranged from 8% at D13A074 and 9% at D22A114 to 87%, also at D13A074 (72 hours), with a median of 26% across the 20 event scores. On the same events it beat four neural baselines (MIMO and autoregressive LSTM and MLP) on 16 of the 20; the MIMO baselines mostly scored 90–99%, close to predicting no flood. None of these runs included persistence. Each seq2seq score is the best of two or three model variants on that same event, so the scores are optimistic, and rainfall was observed, not forecast. The events were picked partly by an automatic P99 peak rule and partly by the hydrologists, so they are not exhaustive, and there is no pooled score for the checkpoints running in production; deciding what replaces them is what the newer campaign is for.
The newer campaign selects a model per station and scores it on the later test period, pooling high-flow MAPE over leads of 1–12 hours:
| Station | Test hours above P99 | Selected model | Selected model MAPE | Persistence | Seasonal-naive |
|---|---|---|---|---|---|
| D13A074 | 117 | GRU | 27.6% | 44.3% | 73.8% |
| D22A114 | 91 | GRU | 37.1% | 50.0% | 72.8% |
| D08A084 | 77 | GRU | 68.6% | 79.3% | 111.5% |
| D08A115 | 13 | GRU | 68.8% | 64.4% | 90.6% |
| E13A031 | 136 | AutoARIMA | 100.0% | — | — |
| D22A082 | 6 | Persistence | 74.7% | 74.7% | — |
| D08A071 | 0 | GRU | — | — | — |
| E13A035 | 0 | N-HiTS with future rain | — | — | — |
— = not exported for this station, or no high-flow test hours to score. Persistence repeats the last observed value; seasonal-naive repeats the same hour one day earlier (24-hour season).
No station passes the newer campaign’s promotion gate: at least 24 high-flow hours, high-flow MAPE under 10%, and valid outputs. The GRU beats persistence at three of the four GRU stations with high-flow test hours; D08A115’s comparison rests on only 13 hours, below the gate’s minimum. E13A031, the station with the most high-flow hours, has no useful model: its validation period had no high-flow hours, so its model was chosen on a different error measure, and it produces a flat forecast near zero. At D22A082, plain persistence was the best candidate, and two stations had no high-flow test hours at all.
Two stations did pass on the validation period, scored from every hourly origin: D08A115 (GRU, 6.75%) and D22A082 (persistence, 6.77%). Neither held on the test period, which had only 13 and 6 high-flow hours there. Errors also grow with lead: at D13A074 the GRU scores 6.9% one hour ahead and 39.7% twelve hours ahead; the gate pools all twelve.
The limit looks like the inputs, not the models. A diagnostic model fed the rainfall that actually fell, up to each target hour, improved every station but brought none under 10% (best: D22A114 at 29.9%), and nineteen model families level off at similar scores. The next gain needs archived weather forecasts, upstream gauges and basin state such as soil moisture.
How the stations were scored
The GRU is one encoder–decoder trained across all eight stations; it forecasts relative to persistence and reads observed future rainfall.
Models were selected per station on a chronological validation period; the table scores the later test period (50/30/20 train/validation/test split with a 24-hour embargo). Selection uses a training-period P99 threshold; evaluation uses a threshold fitted through the validation period. Each legal hourly origin contributes forecasts at leads 1–12, so one high-flow target hour can contribute up to 12 scored pairs; the hour counts are distinct target hours. That final interval has since been reused for diagnostics, so treat these as historical scores, not a fresh holdout.
The backtests feed in observed future rainfall rather than archived meteorological forecasts. They evaluate how models map rainfall to runoff when precipitation is known, not end-to-end warning accuracy; production runs use numerical weather forecasts as the rainfall input.
A high-flow hour is a statistical P99 exceedance, not an approved civil flood stage. At D08A084, 12 hours ahead, the model caught 27 of 77 exceedance hours, missed 50, and raised 8 false-alarm hours.
What I took from it
- A good selected hydrograph isn’t an accuracy claim. The D22A114 event looks excellent; the station table is what a warning system lives with.
- Persistence is the baseline to beat. At short leads, repeating the last value is far stronger than repeating yesterday; it beat the GRU at one station (on 13 hours) and was the best candidate at another.
- Decide what exists at forecast time before scoring. Observed rainfall answers a hydrological question; only issued forecasts answer the warning question.
- Report every station. The ones without enough high-flow hours, or without a useful model, are part of the result.
- Know when the data is the limit. When known rainfall and nineteen model families stall at the same scores, the next gain is upstream gauges and forecast archives, not another architecture.